

A fair creative test follows the same offer from impression to qualified outcome and counts the full cost of making each ad.
Your video gets the views. Your static image gets a handful of enquiries. Which one deserves the next campaign budget? If you are wondering how to compare video vs static ads, the answer is rarely sitting in the engagement column. A view, a click, a lead and a sale are different events, and production costs can change the result again.
To compare video vs static ads, test a matched offer with the same audience, objective, landing page and dates. Choose a business outcome before launch, then compare qualified results and total cost. Keep engagement metrics nearby to explain what happened, not to declare the winner.
Why can video win attention but lose the business result?
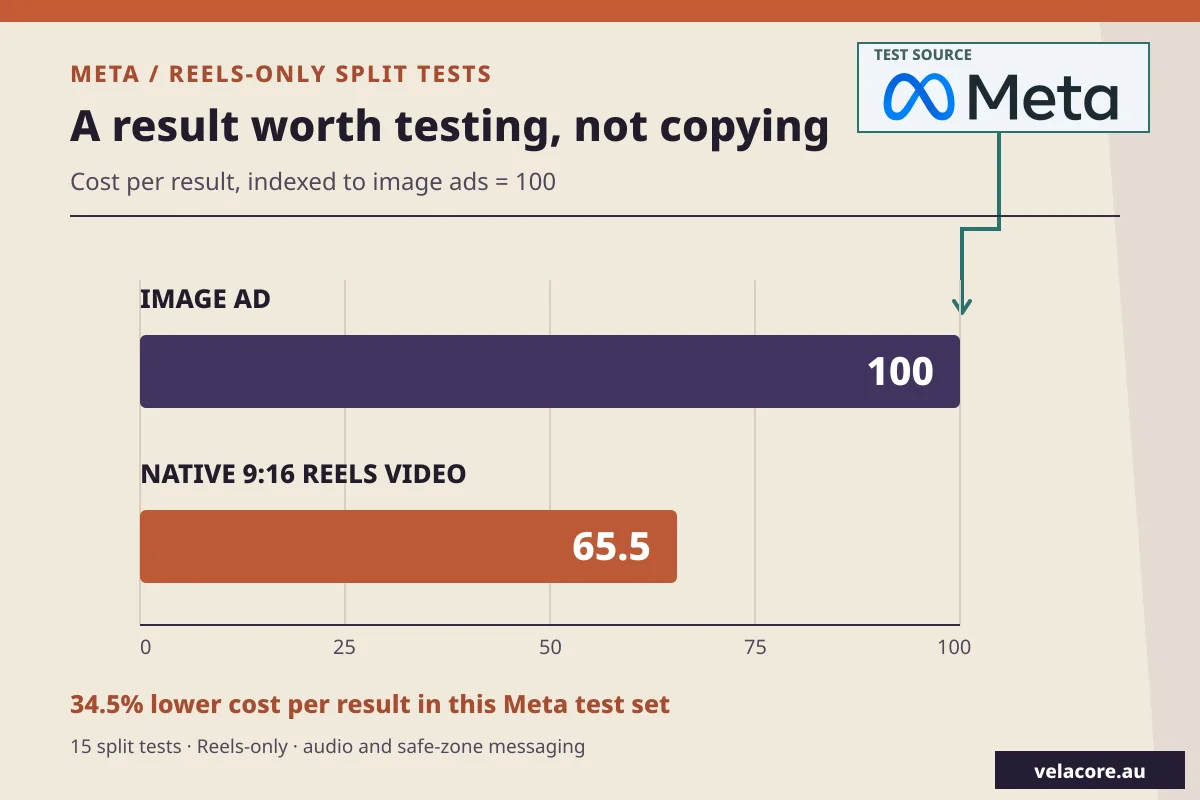
Video has a real advantage in some settings. In a Meta analysis of 15 Reels-only split tests, native 9:16 video with audio and messages in the safe zone delivered a 34.5% lower cost per result than image ads. The tested advertisers were in e-commerce, retail and consumer packaged goods, including small and medium businesses. That is a useful reason to test video for a Reels campaign. It is not a price list for every platform, offer or audience.
| Creative | Relative cost per result | Conditions |
|---|---|---|
| Image ad | 100, indexed baseline | Reels-only campaign |
| Native video | 65.5, calculated index | 9:16 video, audio, safe-zone messaging |
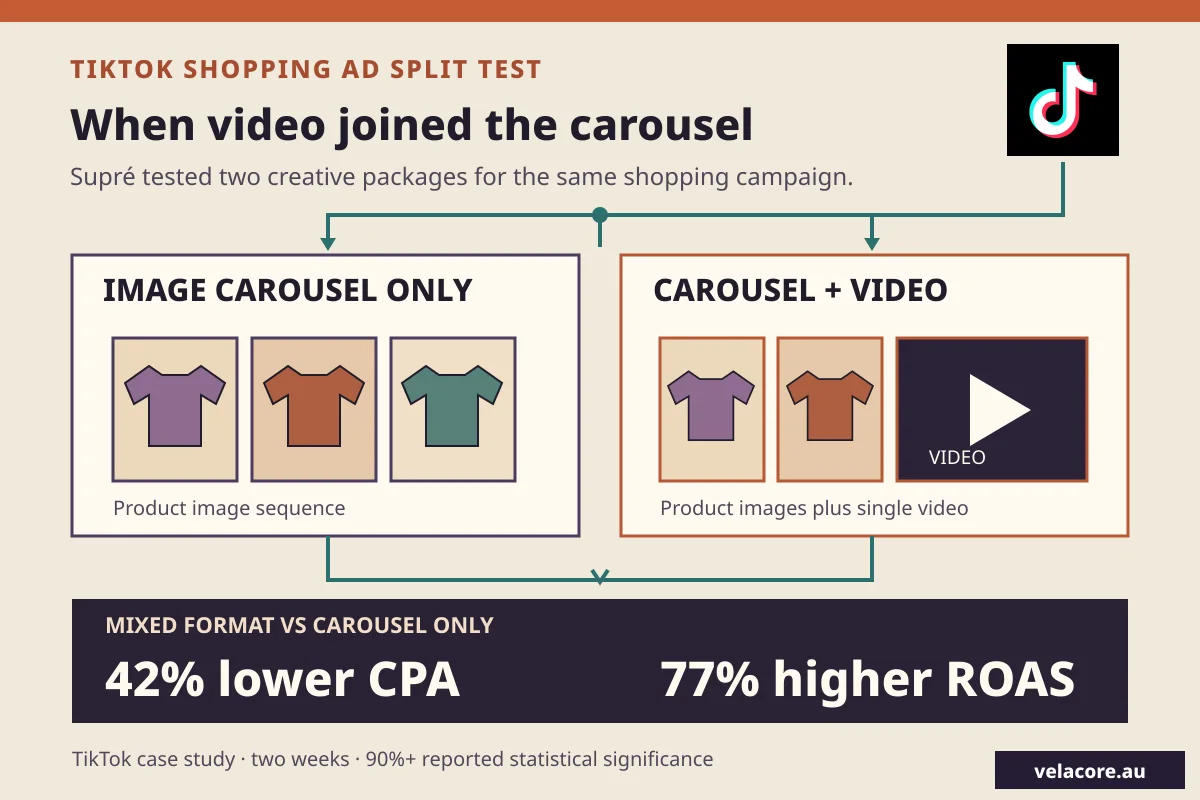
The choice is not always one format or the other. In a TikTok shopping-ad split test, fashion retailer Supré compared an image-carousel-only ad group with a group using the carousel plus a single video with product cards. The mixed group recorded 42% lower cost per acquisition and 77% higher return on ad spend over two weeks; TikTok reports 90%+ statistical significance. That test supports a third option for eligible shopping campaigns: compare a deliberate format mix with a single-format setup. It does not isolate the effect of video on its own.
Now imagine your own campaign. The video may earn cheap attention while the image attracts fewer, better-qualified prospects. Or video may explain a complex product so well that its enquiries close more often. Neither pattern can be inferred from the number of views alone.
The best-performing format is the one that improves the outcome you pay for, after you count lead quality and the cost of making the creative.
What makes a video-versus-static test fair?
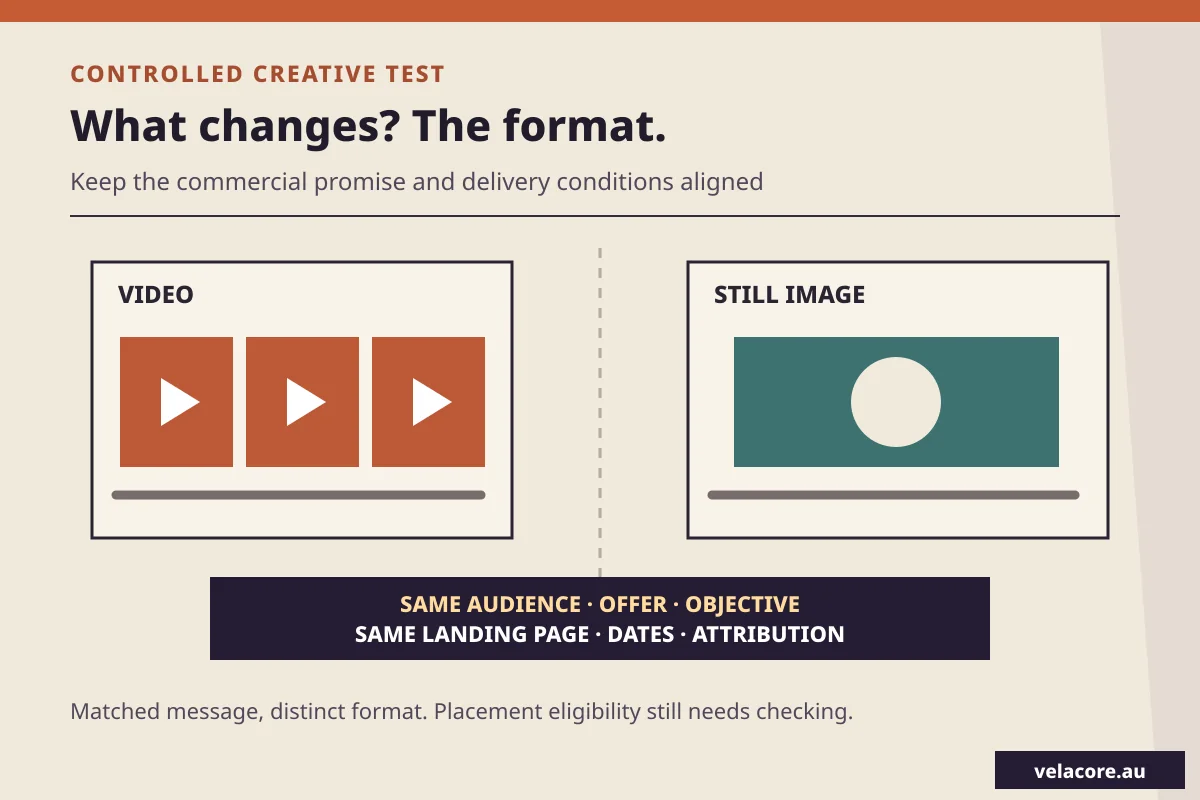
Start with the same commercial proposition. If the static ad says “compare three implementation options” while the video promises a discount, you are testing two offers and two formats at once. That may identify a winning ad, but it cannot tell you what the format contributed.

Write one creative brief before producing either asset: the audience problem, the offer, the supporting proof, the action and the landing page. Then give each format room to work. A still image must make its point immediately; a short video can reveal the same point in a sequence. You cannot make the two experiences identical, and you do not need to. You need them to answer the same buyer question.
Keep these controls fixed during the first read:
- Campaign goal: compare lead generation with lead generation, not video views with website conversions.
- Audience and geography: use the same eligible audience and exclusions.
- Offer and destination: send both ads to the same landing experience with the same form or checkout.
- Timing and budget rule: launch together and avoid changing one arm mid-test.
- Measurement: use the same conversion definition and attribution window.
Placement is the difficult one. Some placements favour or require a particular format. If the video runs in Reels and the image runs only in a feed, the result compares two format-and-placement packages, not a pure format change. Record that distinction before you present the winner. TikTok’s Split Testing can isolate creative variables across exclusive audience groups; its creative-variable documentation includes images, videos and ad formats, subject to campaign eligibility.
Which number should decide the next budget?
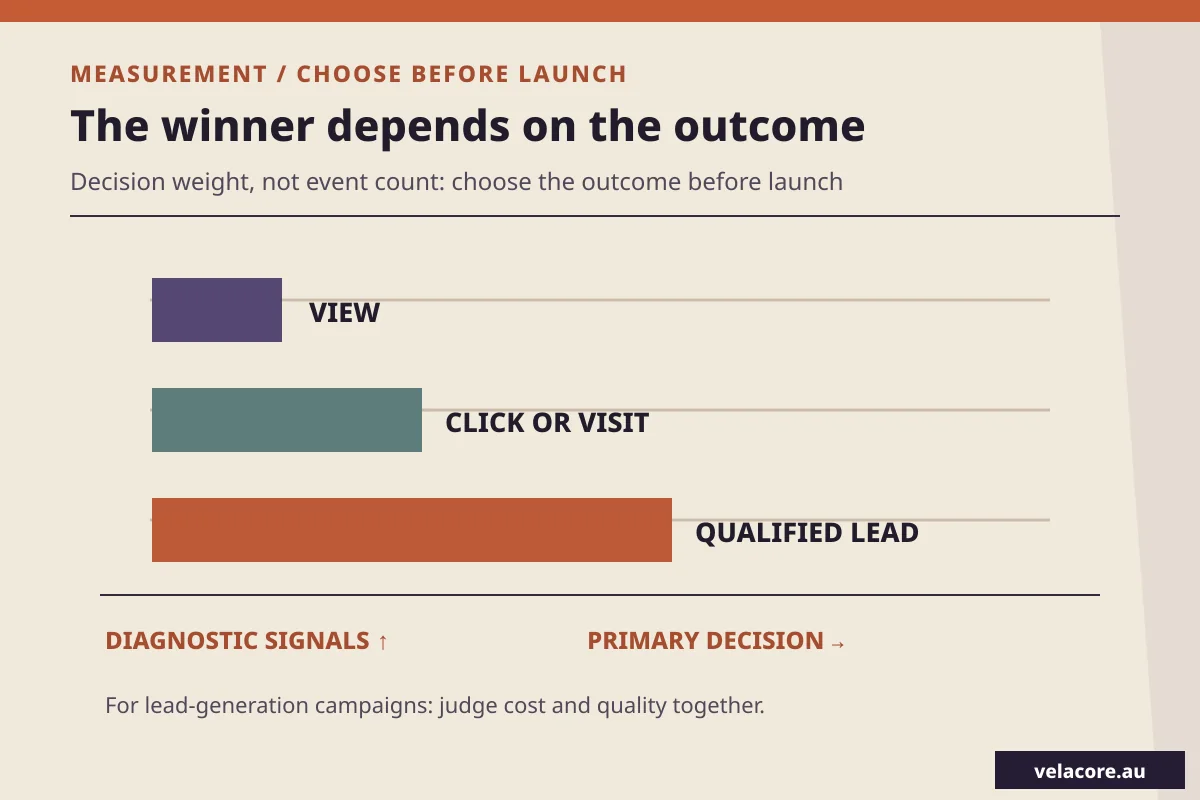
Choose the primary measure from the business goal, then use the earlier signals to explain it. If you sell online with reliable order and margin data, compare contribution after ad and creative costs. If you generate sales enquiries, cost per qualified lead is usually more useful than cost per form submission. A qualified lead meets your agreed fit criteria, such as service need, location, budget or buying stage. Define those criteria before the campaign runs.

For a lead-generation test, keep a short scorecard:
- Primary: all-in cost per qualified lead, or a later sales outcome when enough reliable data exists.
- Quality check: percentage of leads meeting the agreed fit criteria and the sales team’s disposition notes.
- Diagnostics: impressions, click-through rate, landing-page visits, form starts and completed submissions.
- Production: asset creation, editing and reusable footage or design costs, allocated consistently.
The diagnostic metrics still matter. A low click-through rate may reveal an unconvincing hook. A strong click rate with few form completions may point to the landing page. They tell you where the path weakens. They do not replace the outcome you selected.
How do you run the comparison without crowning a false winner?
Use the platform’s experiment or split-test tool when it can separate the audiences. Two ordinary ads placed in one ad set are useful for exploration, but delivery algorithms may give them unequal exposure. A split test gives you a clearer comparison because each group is assigned a version.
- State the hypothesis. For example: “For this offer and audience, short video will lower all-in cost per qualified lead compared with a static image.”
- Choose the primary outcome and qualification rule. Agree what the sales team will count before results arrive.
- Build matched creatives. Hold the offer, proof, destination and action steady while changing the format.
- Check the platform’s test eligibility. Confirm that both formats can run for the objective and placement you intend to compare.
- Set dates and a feasible budget. Use the platform’s power estimate or historical conversion rate rather than an arbitrary spend target.
- Launch together and avoid mid-test edits. Keep a dated record of any unavoidable change.
- Read platform and business data together. Compare delivery and conversions, then review lead quality and all-in cost.
For TikTok specifically, its split-test guidance recommends at least seven days, no more than 30 days, and an estimated testing power of at least 80%. These are TikTok’s settings and recommendations, not a universal rule for every ad network. Google’s custom experiment guidance adds an important measurement warning: a 50/50 traffic split does not guarantee equal impressions or spend because delivery is still determined in auctions. Read actual delivery before comparing cost.
What changes when you count production and lead quality?
Here is a worked example, not a claim about a real campaign. A static ad and a short video each receive $600 in media spend. The static costs $100 to make; the video costs $300. The video produces more raw leads and one more qualified lead, but the static ad is slightly cheaper for each qualified opportunity.
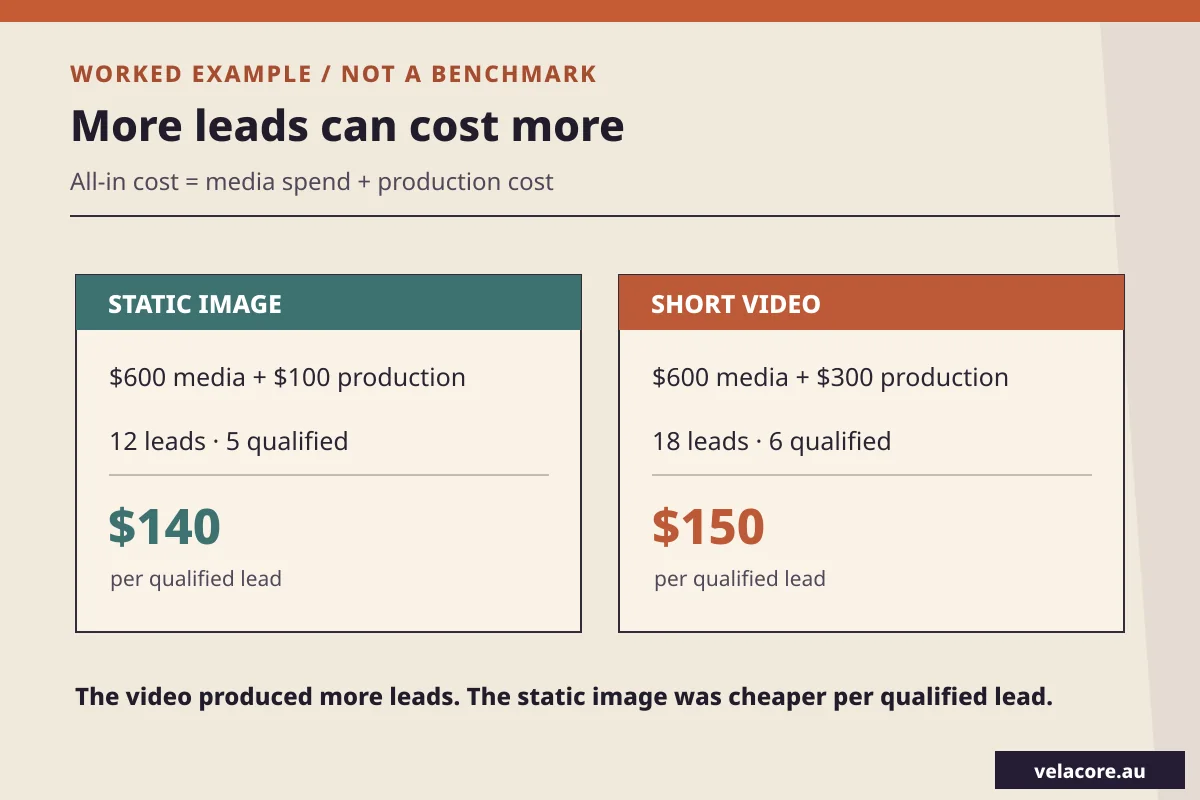
| Format | Media | Production | Raw leads | Qualified | All-in cost per qualified lead |
|---|---|---|---|---|---|
| Static image | $600 | $100 | 12 | 5 | ($600 + $100) ÷ 5 = $140 |
| Short video | $600 | $300 | 18 | 6 | ($600 + $300) ÷ 6 = $150 |
The video generated 50% more raw leads in this example, yet its all-in qualified-lead cost is higher. That does not make static ads universally better. If the video leads close at a higher rate, produce larger deals or can reuse the footage over several campaigns, the commercial answer may change. Record those facts rather than deciding from the first lead-count column.
What if the ad platform and your lead records disagree?
They may count different journeys. A platform can credit an action after a click or, depending on settings, after a view. TikTok’s attribution definitions distinguish click-through, view-through and engaged-view paths. Its conversion-window guidance also shows that the lookback setting changes which actions are eligible for credit. A view-through conversion is a reporting signal, not proof that the ad alone caused the purchase.
Use a consistent landing URL and tag each creative so that website sessions can be inspected alongside the platform report. Google’s Analytics URL-builder guidance recommends a distinct utm_content value for the displayed creative and consistent source, medium and campaign values. Do not overwrite auto-tagging or change the UTM scheme halfway through the test.
Then compare three records: what the platform delivered and attributed, what the website recorded, and which enquiries your team accepted as qualified. Do not force them into an identical total. Investigate large gaps, duplicate leads, broken forms and different attribution windows before announcing a winner.
When do you scale, retest or stop?
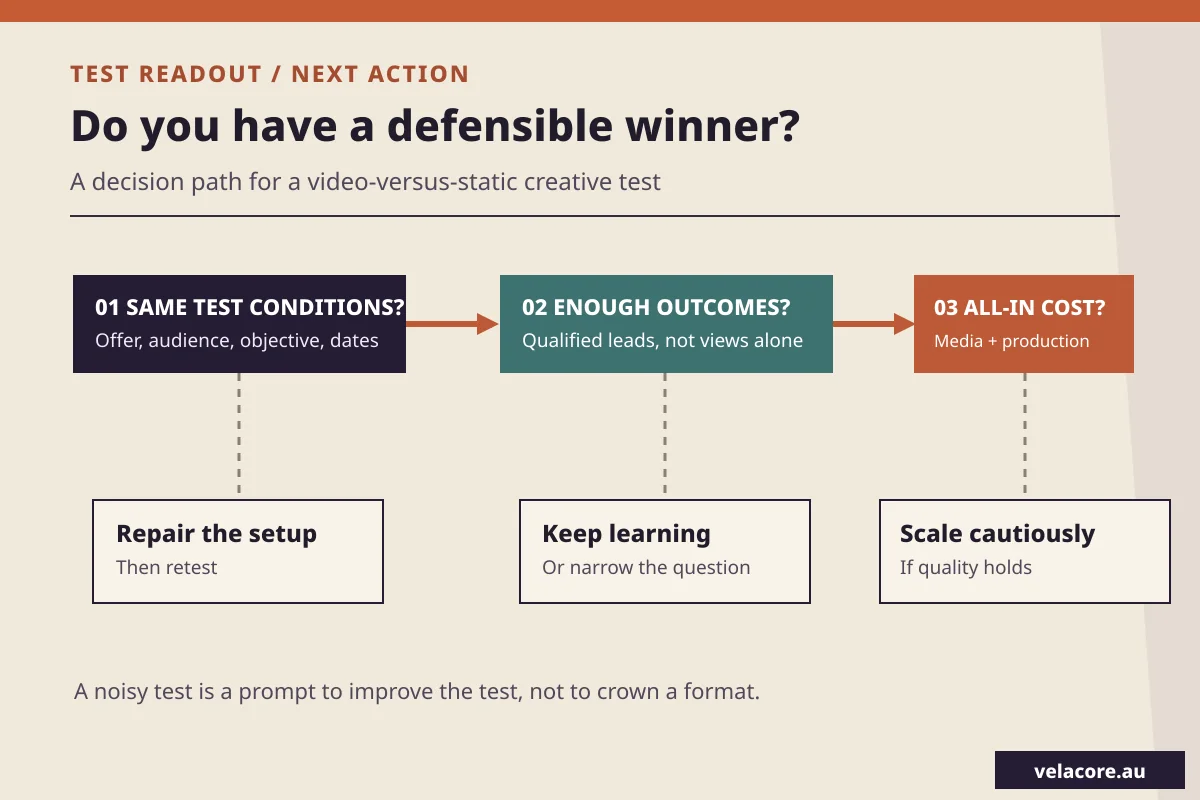
Not every test produces a winner. If the audiences, offer or landing pages differed, fix the design and run it again. If there are too few qualified outcomes, keep learning or narrow the question. If one format has a lower all-in cost and lead quality holds, scale carefully and watch whether that result survives a larger audience.
Start with one offer and one audience where both formats can serve. If you need the broader pros and cons before selecting a test, read our overview of short-form video and static ads. This guide takes the next step: choose the outcome, match the promise, run the test and read the result against your actual costs. The same measurement discipline belongs in your wider digital strategy, so the winning ad also supports a useful customer journey.
The creative format is a hypothesis. The business result is the decision. If you want help setting the measurement and deciding what the result warrants, tell Velacore what you are selling and what counts as a good lead.
Frequently asked questions
Can I compare a video ad and a static ad in the same campaign?
Yes, if the campaign objective and placement allow both. For a cleaner comparison, use the platform’s split-test tool so the audience groups are separated. If each format runs in a different placement, describe the result as a format-and-placement test.
Should I run video and static ads together?
Sometimes. If the platform supports both formats for your objective, a third test arm can compare a deliberate mix against either format alone. In Supré’s TikTok shopping-ad test, carousel plus video outperformed carousel-only on acquisition cost and return on ad spend. Count the added production cost and check your own qualified outcomes before adopting the mix.
Should I choose the ad with the highest click-through rate?
Only if clicks are the outcome you set out to buy. For lead or sales campaigns, CTR is a diagnostic. Compare qualified leads, sales and all-in cost first; then use CTR to understand where one creative attracted or lost attention.
What if the test produces too few qualified leads?
Do not turn a handful of outcomes into a universal verdict. Check the platform’s estimated testing power, spend and duration, then extend a clean test or choose a narrower question. You can still learn from delivery and click patterns, but label the result directional.
Does reusable video footage change the cost calculation?
It can. Allocate the production cost across the campaigns that genuinely use the footage, then apply the same accounting method to reusable static assets. Keep the allocation written down so the comparison cannot be changed after you see which format won.