
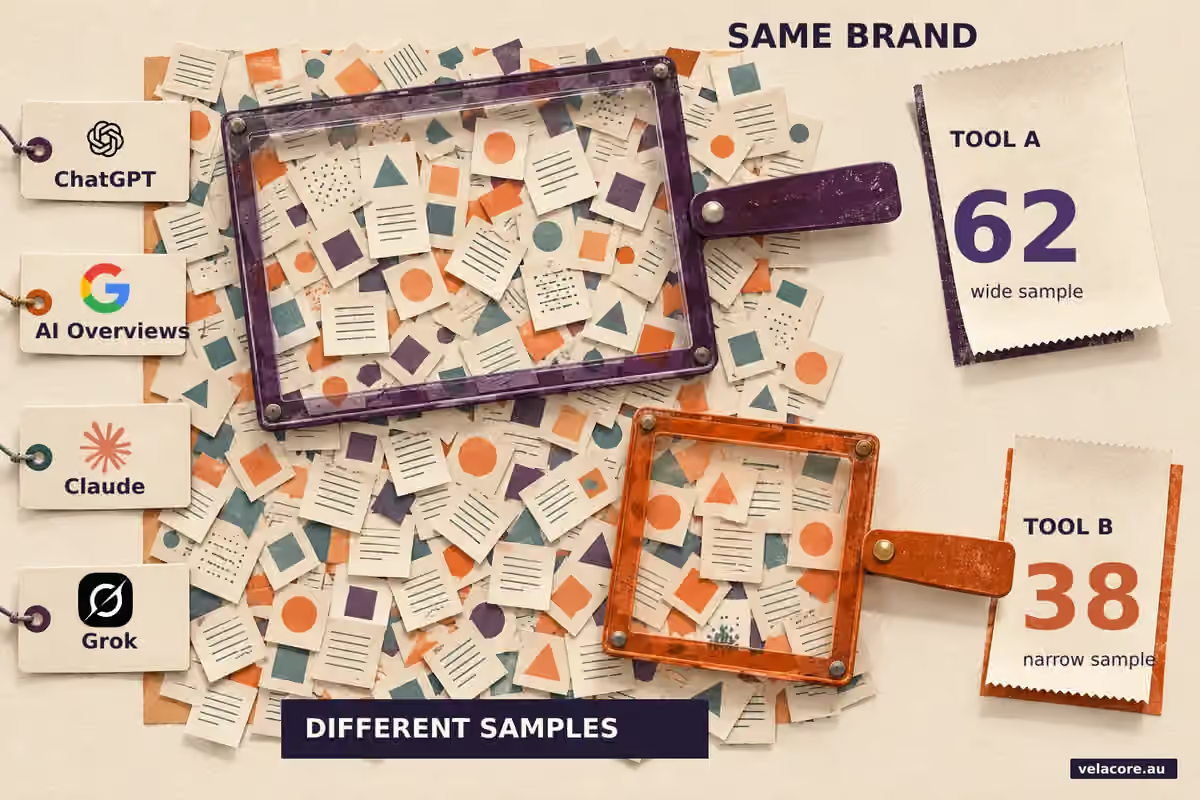
A dashboard says your brand has an AI visibility score of 62. Another tool says 38. Which one is right? Before you buy a subscription or rewrite your content around either number, ask what each product actually counted. AI visibility tools sample prompts and answers using different methods. Their scores can be useful signals, but they are not a universal ranking of your brand across ChatGPT, Google and every other assistant.
Here is the practical answer: use a tracker to find which relevant questions include you, which sources are cited, and what changes over time within the same method. Then compare that evidence with your own search impressions, referral visits and qualified enquiries. A score alone cannot tell you whether customers found your business.
A precise score can still answer the wrong question.
Why can two AI visibility tools disagree about the same brand?
The disagreement starts before either tool calculates a score. Which questions did it ask? In what language and market? Which AI products did it query, on what dates, and how many times? Did it count a brand name in the answer, a link to your page, or an estimated number of people who might see that answer?
The Interactive Advertising Bureau’s 2026 measurement framework describes a market with more than 20 AI visibility providers using differing methods. That does not make every product unreliable. It means that an identical-looking percentage can describe a different population of answers.
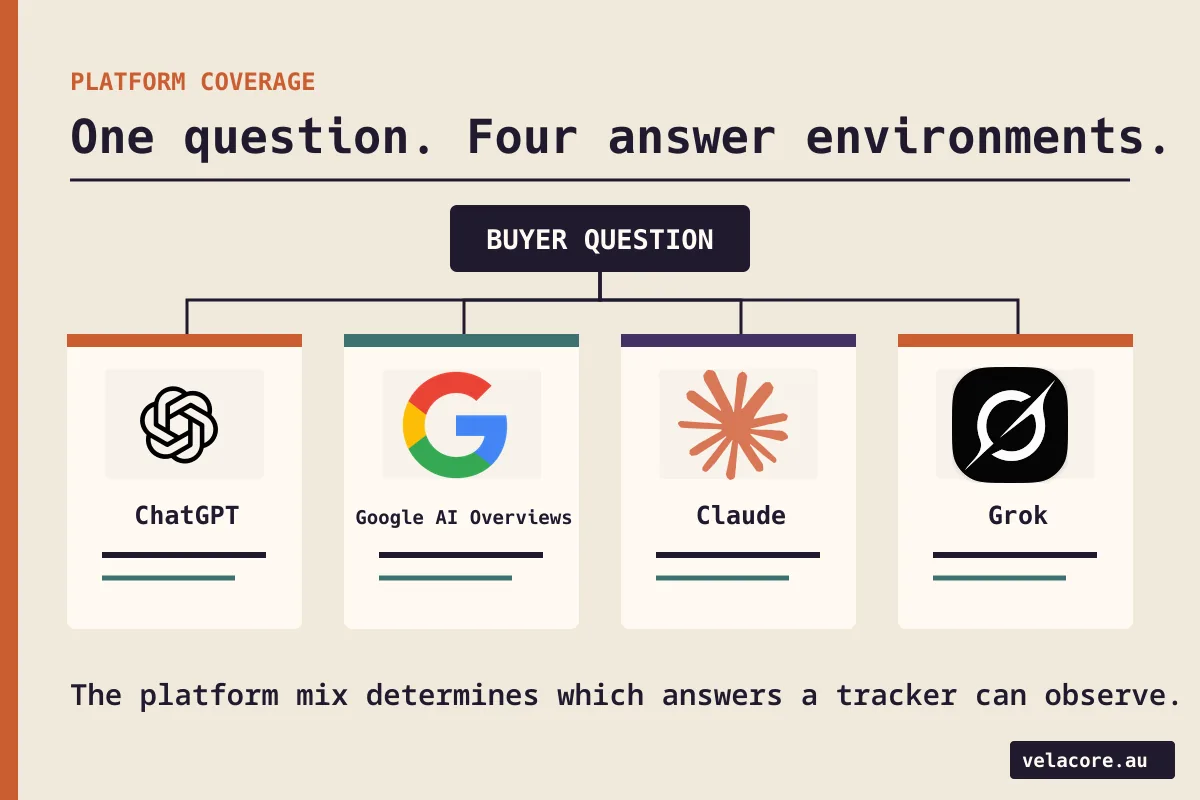
A prompt universe is simply the set of questions a tracker decides to observe. A B2B software company could be nearly absent from a broad set of consumer questions while appearing regularly for the specialist purchasing questions that matter to its pipeline. Add more unrelated questions and its overall percentage falls, even if nothing changed for its buyers.
What do Ahrefs, Semrush and Profound actually measure?
These are three widely discussed products, but their headline measures are not interchangeable. The comparison below is based on their published methodologies, not a claim that we ran a controlled test of their paid dashboards.
| Tool and metric | What it counts | What the number cannot prove |
|---|---|---|
| Ahrefs Brand Radar | A mention is one response containing the brand. Its AI impressions model sums Google search volume for prompts where the brand appears; AI share of voice compares modeled impressions with tracked brands. | Modeled impressions are not observed AI answer views, and the competitor set can change the share. |
| Semrush AI Visibility | A 0 to 100 composite of topic coverage and mention consistency across its prompt and response database. | A score of 70 does not mean your brand appears in 70% of all AI answers. |
| Profound Visibility | Responses mentioning your brand divided by sampled responses mentioning at least one brand. Its share of voice uses total brand mentions as a different denominator. | It is not the share of all questions asked by real users or a conventional search position. |
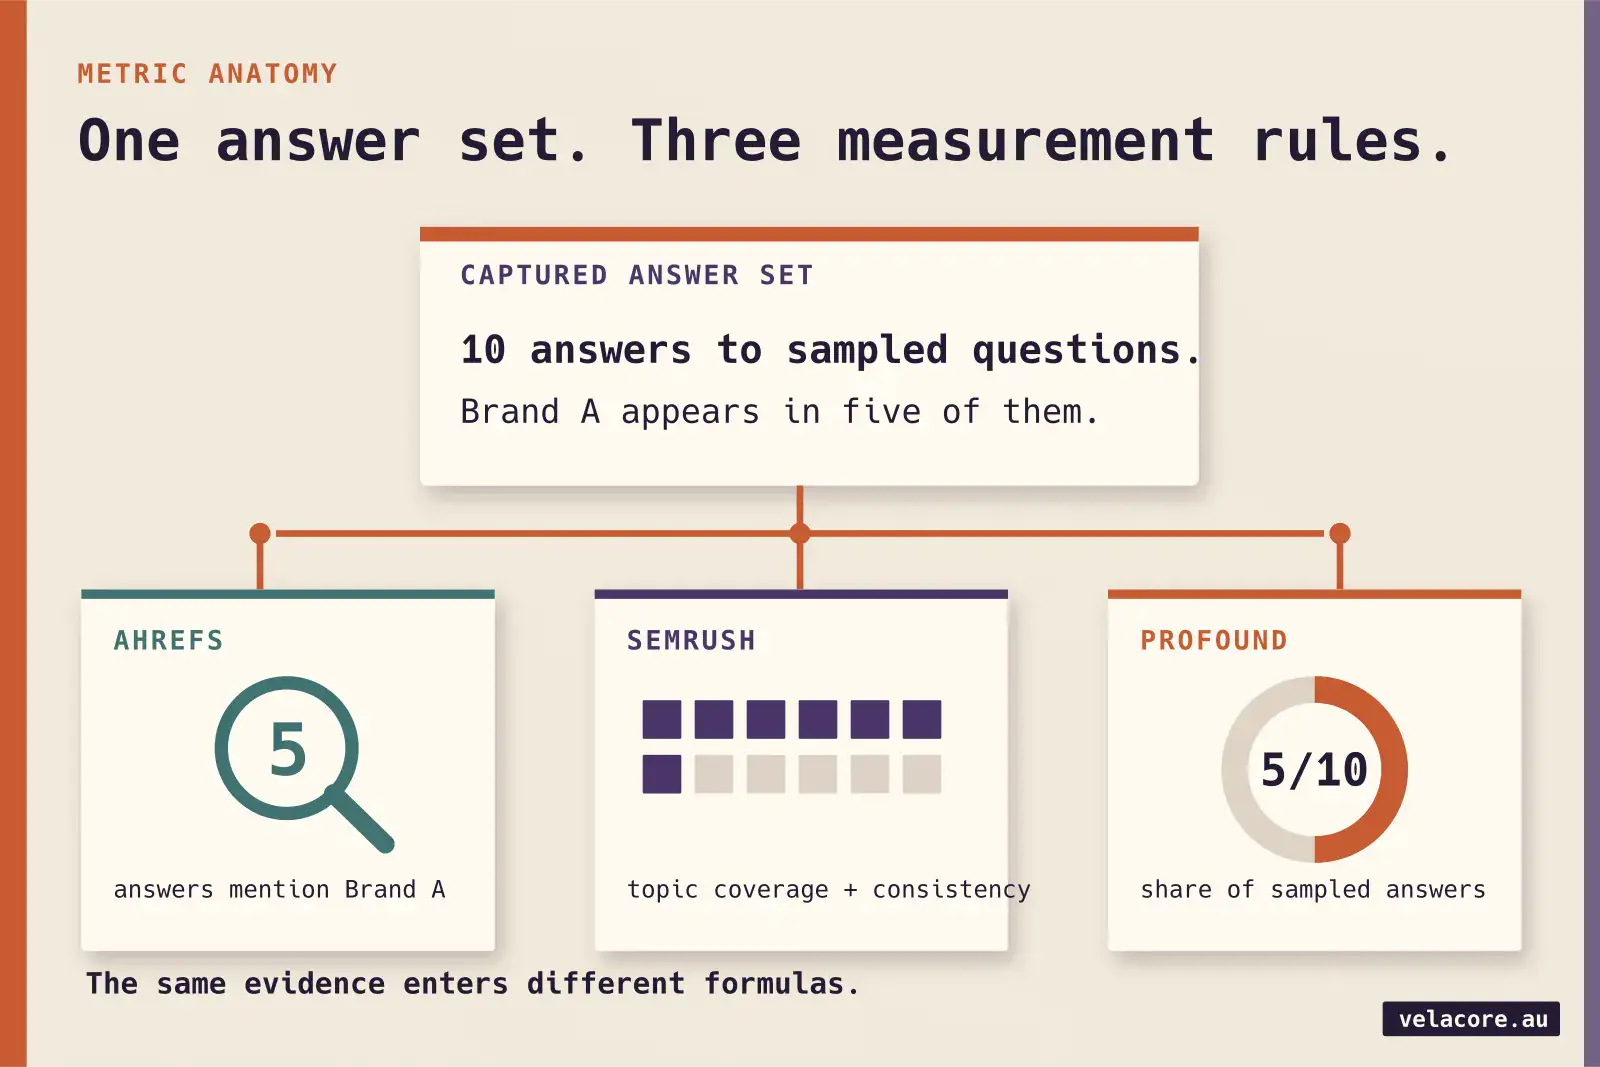
Ahrefs explains that a brand appearing three times in one answer still counts as one mention. A citation is counted when a page is cited at least once in an answer. Its modeled AI impressions draw on Google search-volume data associated with prompts, so the word impressions does not mean it observed that many people reading an AI answer.
Semrush describes a different construction: topic coverage plus mention consistency, represented as a 0 to 100 score. Its documentation says its prompt database contains more than 317 million prompts and responses across 117 regional databases. Those are vendor-reported dataset figures, not a count of your customers or proof that a particular niche is well represented.
Profound’s documentation makes the denominator unusually clear. If your brand appears in five of ten sampled responses that contain any brand, visibility is 50%. Its share of voice instead divides your brand mentions by all brand mentions. Both can be useful, but they answer different questions.
How can a score change when your real visibility has not?
Consider a deliberately simple example. A tracker observes ten answers that mention at least one brand. Your company appears in five. Under Profound’s published visibility formula, the result is 5 divided by 10, or 50%. Now the tracker adds ten new questions about a service you do not sell. Their answers name other brands but never yours, so the combined result becomes 5 divided by 20, or 25%. You did not lose a mention on the questions that matter to your buyers. The sample changed.
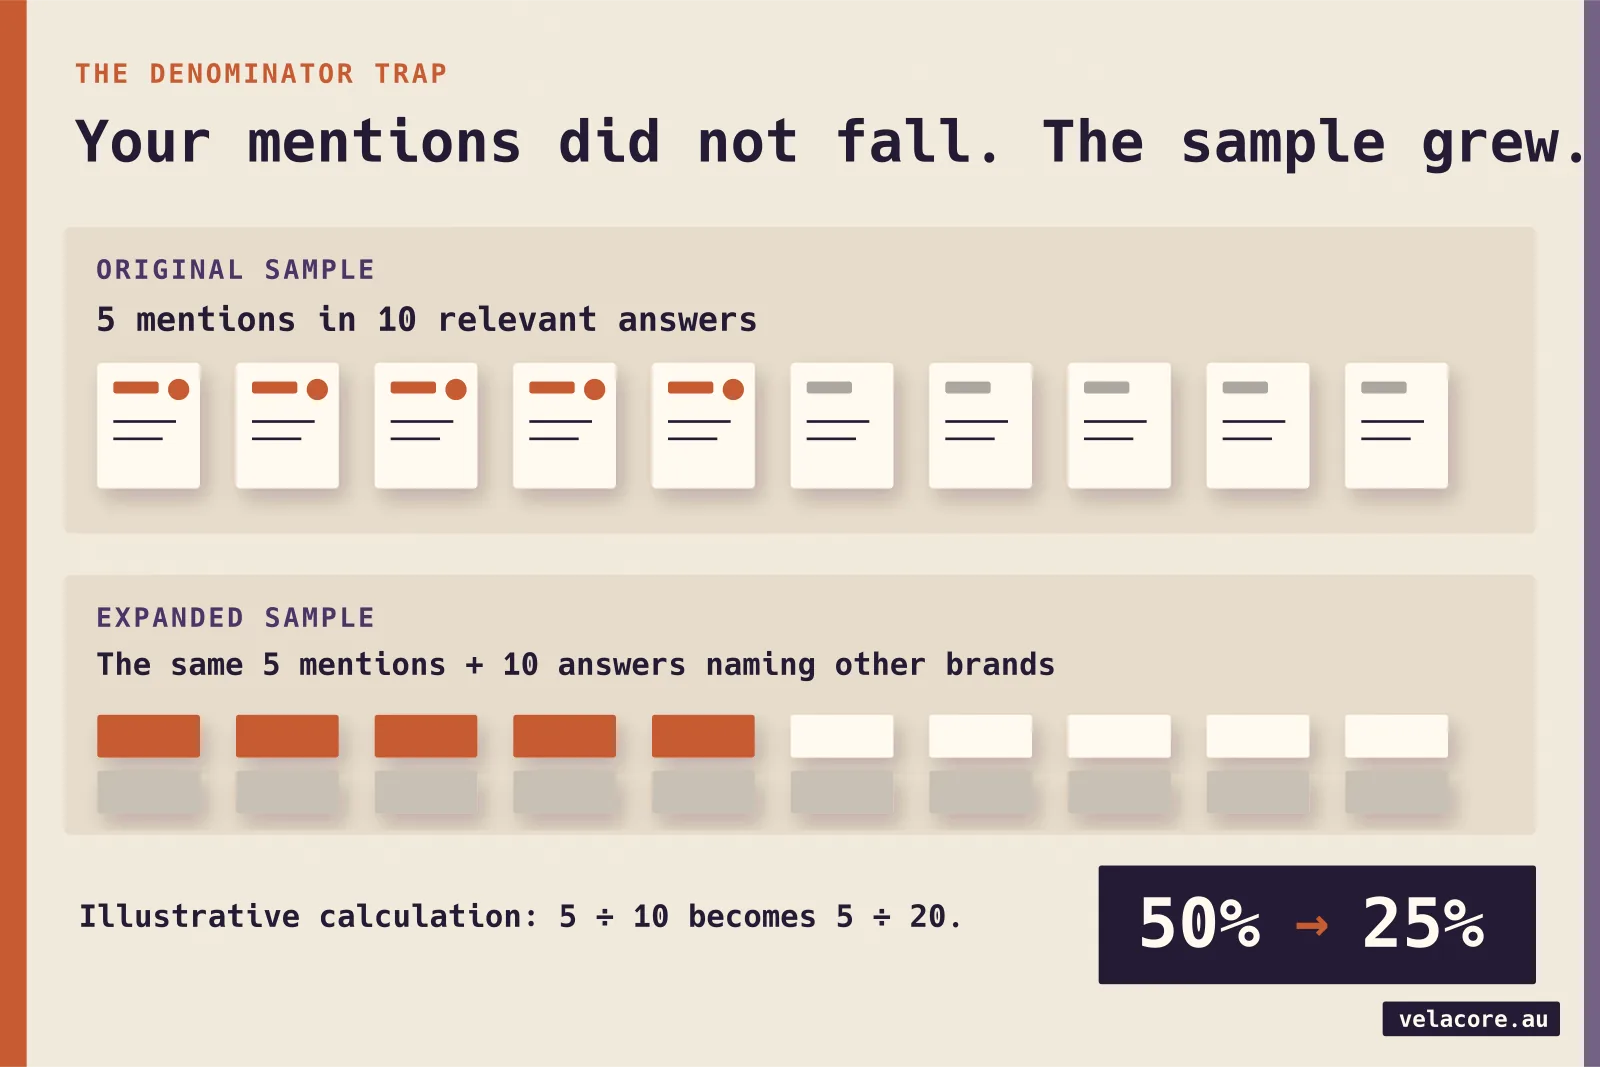
The reverse also happens. Narrow a report to favourable prompts and a score may rise without a new customer ever seeing your brand. Ahrefs notes that its share-of-voice number can shift substantially with the brands selected for comparison. A genuine month-on-month improvement therefore needs a stable question set, market, platform mix and method, with changes disclosed.
This is the first piece of new knowledge a buyer can use immediately: treat the definition of the sample as part of the metric, not as small print under it.
Can repeated prompts give you a stable AI ranking?
Do not expect the same numbered list every time. In a 2026 original field study, SparkToro and a researcher from AI measurement company Gumshoe.ai gathered 2,961 responses from 600 volunteers using 12 prompts across ChatGPT, Claude and Google’s AI features. For the brand-recommendation prompts tested, identical lists were rare across repeat runs. The study reported less than a 1-in-100 chance of the same list recurring for ChatGPT or Google AI in its comparisons, and even less consistency in ordering.
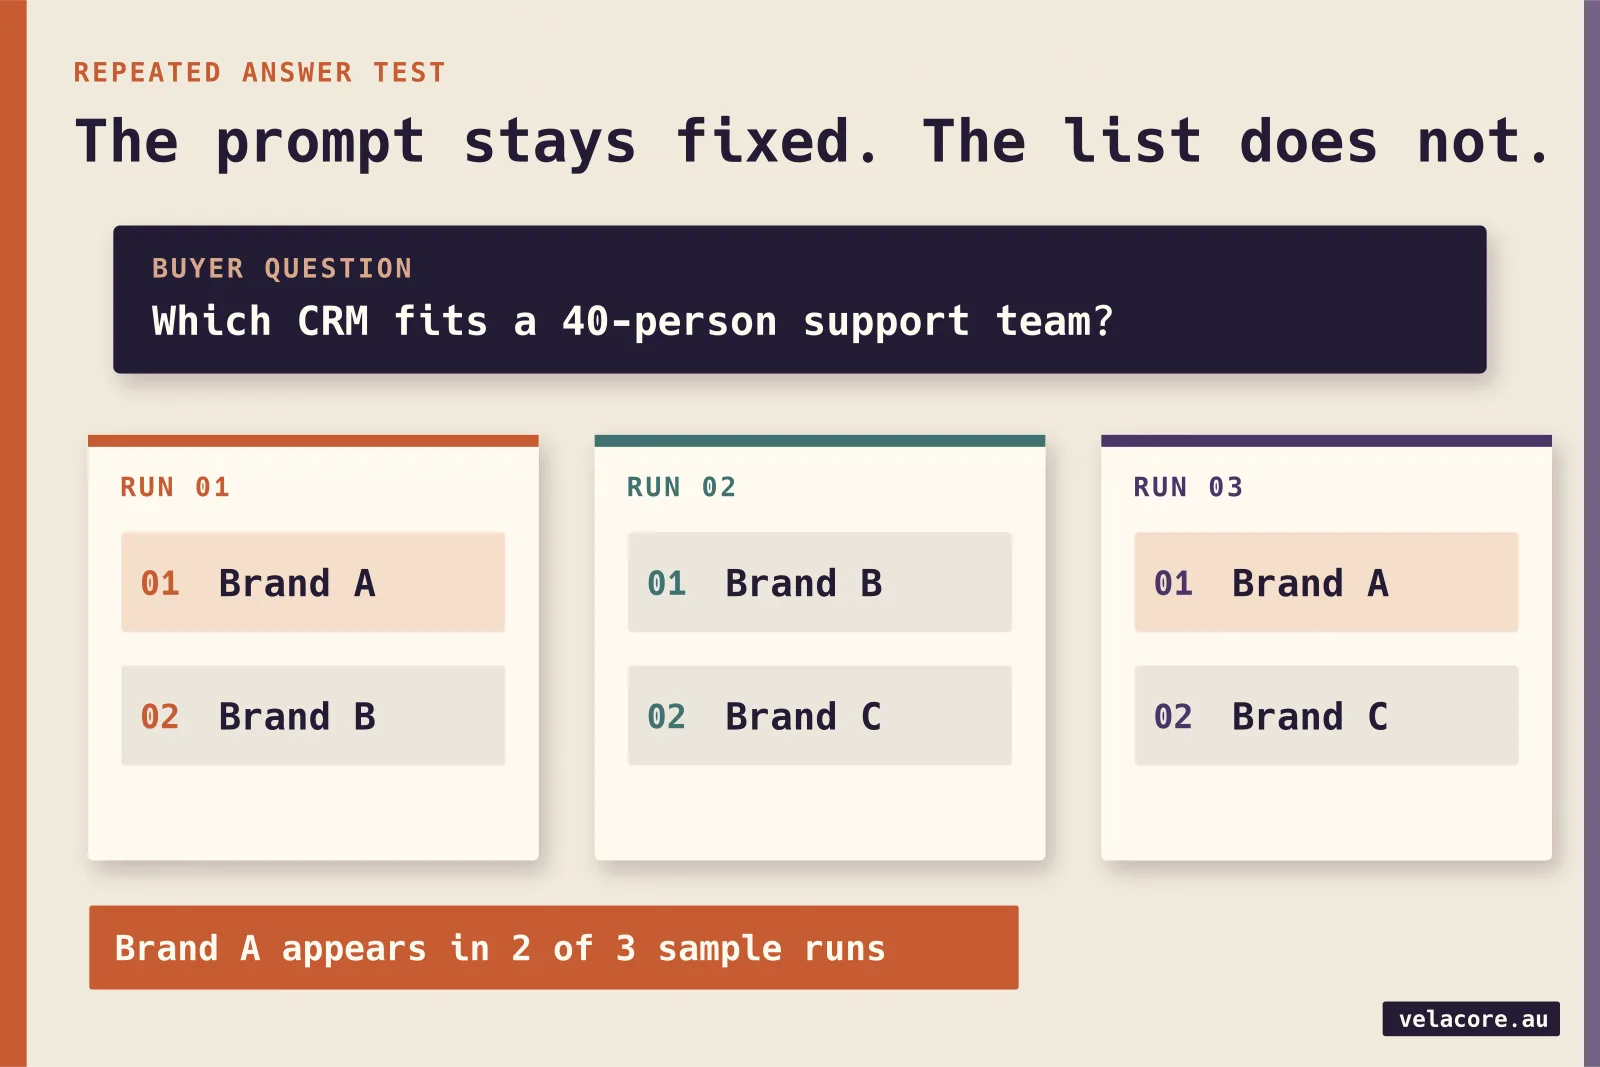
The study’s collaboration with a measurement vendor is relevant context, and its findings concern its tested prompts, not all assistant behaviour. The useful lesson is still clear: a one-off screenshot is weak evidence. Ask for the frequency of mentions across repeated runs and a stable method for comparing periods. If your brand appeared in 18 of 20 relevant answers last month and 19 of 20 this month, that alone is too small a change to proclaim a strategic breakthrough.
Count the answer more than once before you call it a trend.
Do citations and visibility scores lead to visits?
Sometimes they can. They are not the same event. A model may mention your brand without linking to your site. It may cite a page that the user never opens. A visitor may later search your name and arrive through a different channel. A tracker that sees an answer cannot observe all of those journeys.
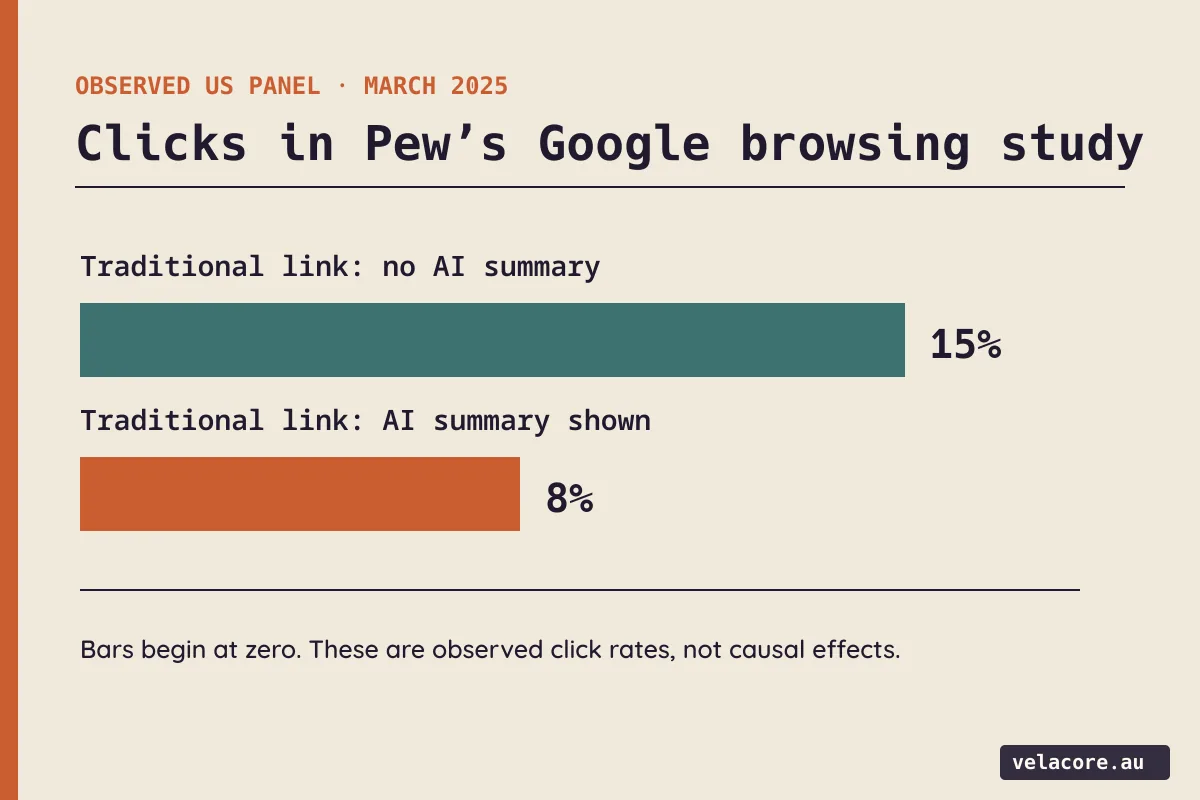
In a Pew Research Center analysis of 68,879 Google searches by 900 US adults in March 2025, users clicked a traditional result in 8% of searches with an AI summary, compared with 15% of searches without one. They clicked a link within an AI summary in 1% of searches where a summary appeared. Those are observed rates in one US panel, not proof that the summary caused the difference or a prediction for every market.
| Search condition | Clicked a traditional result | Clicked a source link inside AI summary |
|---|---|---|
| No AI summary shown | 15% of those searches | Not applicable |
| AI summary shown | 8% of those searches | 1% of those searches |
That gap is why a citation count belongs next to visit and lead data. It also explains why you should not call a citation a lead. A buyer may learn your name in an answer and act later, but that influence needs a more careful assessment than a direct-click report can provide.
What can your own data confirm that a GEO tool cannot?
Start with three different kinds of observation. Google Search Console’s generative AI performance report, rolled out worldwide in August 2026, shows impressions for links to your site in AI Overviews and AI Mode on Google Search, including page, country and device breakdowns. It does not measure ChatGPT answers. It may be absent when a site has insufficient impressions.
GA4’s AI Assistant channel identifies visits from referring assistants such as ChatGPT, Gemini, DeepSeek, Copilot and Grok. Google says its AI Overviews and AI Mode traffic is classified under Organic Search instead. GA4 therefore helps you see some actual visits, but it does not count all answer exposures or prove which answer convinced a visitor.
Finally, your CRM or enquiry records tell you which visits became relevant opportunities. That third layer is a business decision: define what qualifies, record it consistently and compare it with the source information you actually have.
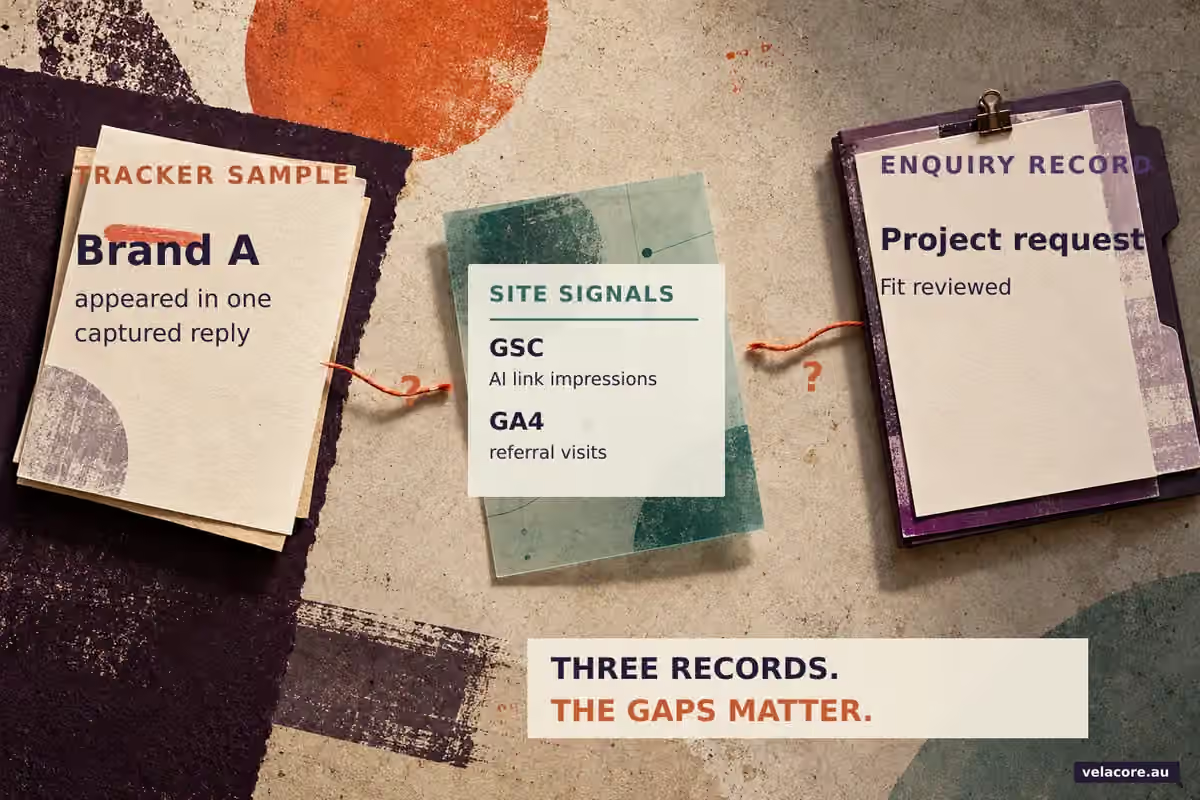
- Tracker: Which relevant prompts mention or cite the brand, on which platform and with what frequency?
- First-party analytics: Which links earned Google AI-feature impressions, and which referring assistants sent actual visitors?
- Lead review: Which enquiries matched the work you sell, and what is known about their route to you?
If the tracker improves while first-party measures remain flat, inspect the prompt set and the pages cited before celebrating. If relevant impressions and visits rise but qualified enquiries do not, examine the page promise and conversion path. Our guide to AI assistant traffic in GA4 explains the referral layer in more detail, while Velacore’s SEO and AI search approach covers the discoverability work behind it.
What would make an AI visibility tracker worth paying for?
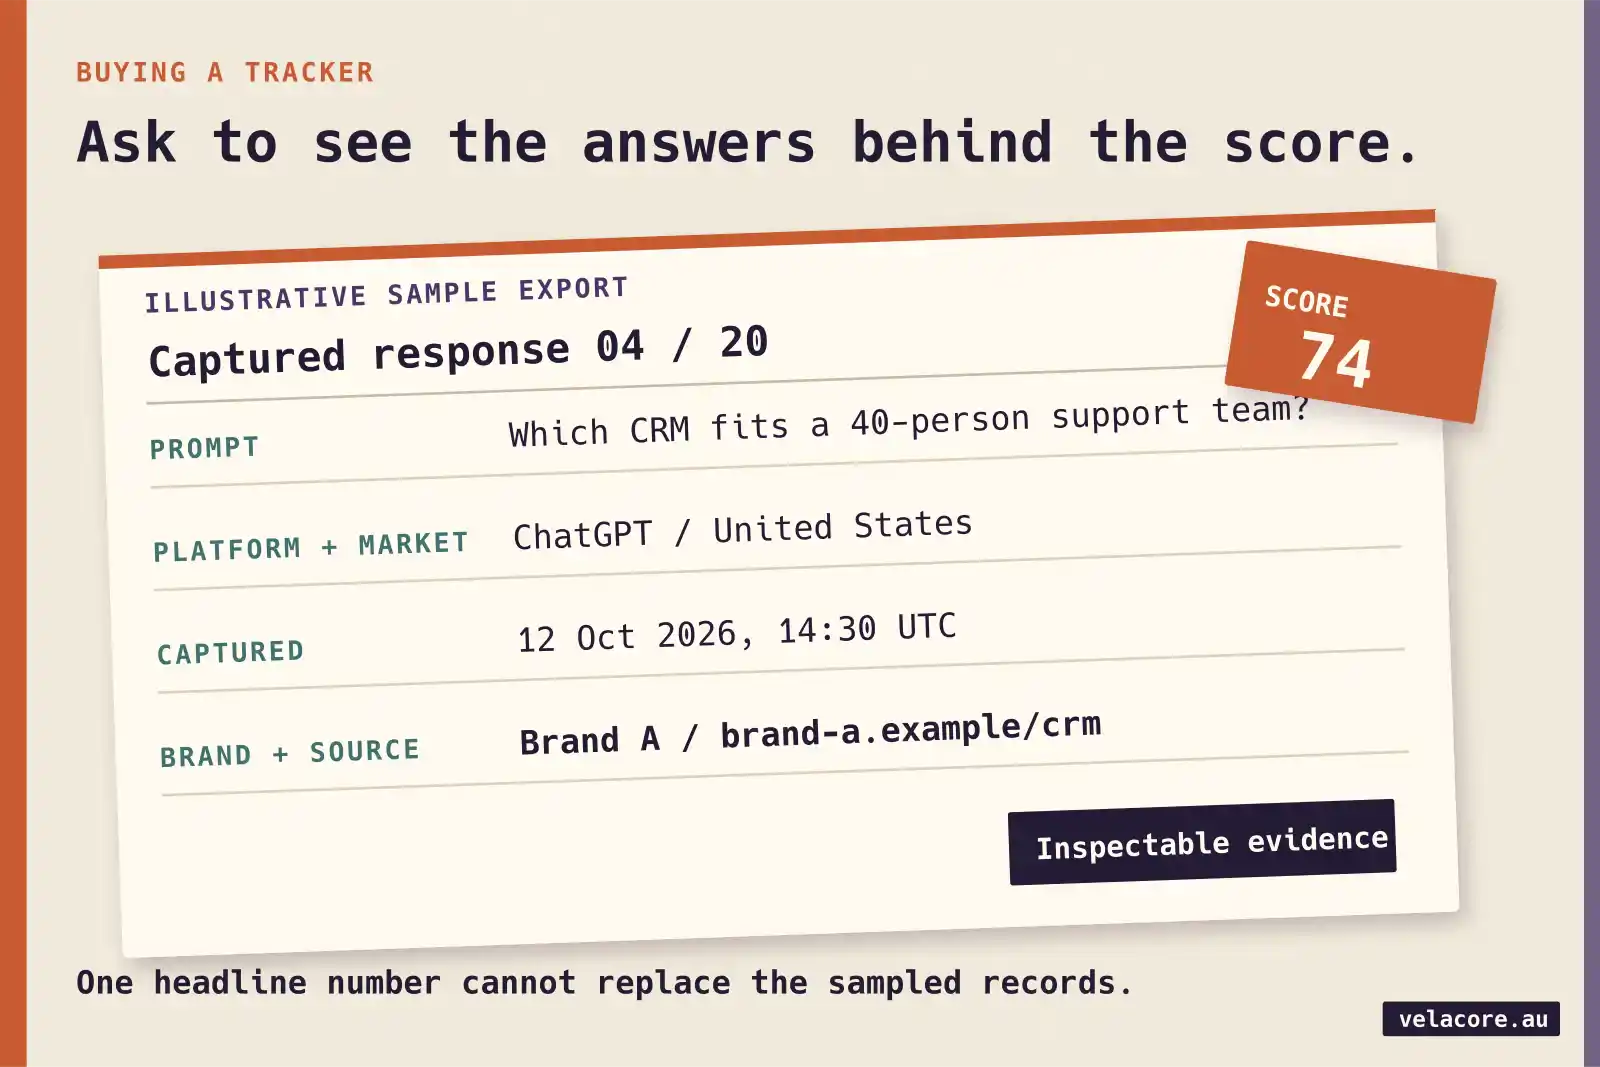
Ask the provider for a sample export before you buy. It should let you inspect real prompts and answers, filter by a market you serve, see the source and date, and separate brand mentions from citations. Compare a handful of its questions with the language customers actually use. A large database can be valuable, but scale alone cannot rescue an irrelevant sample.
- Prompt fit: Can you see and edit the questions, markets and languages behind the report?
- Platform coverage: Which assistant products, modes, locations and dates were actually sampled?
- Brand matching: How are namesakes, product names and variations handled?
- Denominator: Is the score a response share, a modeled audience estimate, a competitor comparison or a composite index?
- Repeatability: Are answers sampled often enough to separate a pattern from one unstable response?
- Actionability: Can you inspect cited URLs and connect findings to Search Console, GA4 and lead review without pretending the systems measure the same event?
There is no need to chase one number across incompatible dashboards. AI visibility tools earn their place when they answer a defined business question. Choose a stable set of commercially relevant prompts, use each tracker according to its documented method, and review observed visits and qualified enquiries alongside it. Count the answer, then count the customer.
Frequently asked questions
Is an AI visibility score the same as a Google ranking?
No. A Google ranking describes a result’s position for a specified search context. An AI visibility score may be a response percentage, a modeled share or a composite index across sampled prompts. Read the tool’s definition before comparing it with search positions.
Why does my AI visibility score change when I have not changed my website?
The tool may have sampled different prompts, answers, competitors, models or locations. Repeated AI answers can vary too. Check its methodology and the underlying response examples before treating a small movement as progress or decline.
Should I track mentions or citations?
Track both when they answer different decisions. Mentions reveal whether the brand appears in relevant answers; citations show which linked sources the tool observed. Neither alone measures how many people read the answer or became customers.
Can GA4 show all traffic influenced by AI answers?
No. GA4 can record qualifying referral visits from AI assistants, but a person may read an answer and arrive later by another route. Google AI Overview and AI Mode visits also sit under Organic Search in GA4’s default channels.
What is the best first metric for a small team?
Start with a small, stable list of buyer questions and inspect the actual answers and citations. Pair that with first-party impressions or visits where available and a simple review of qualified enquiries. Expand the tool stack only when a specific decision needs more coverage.