
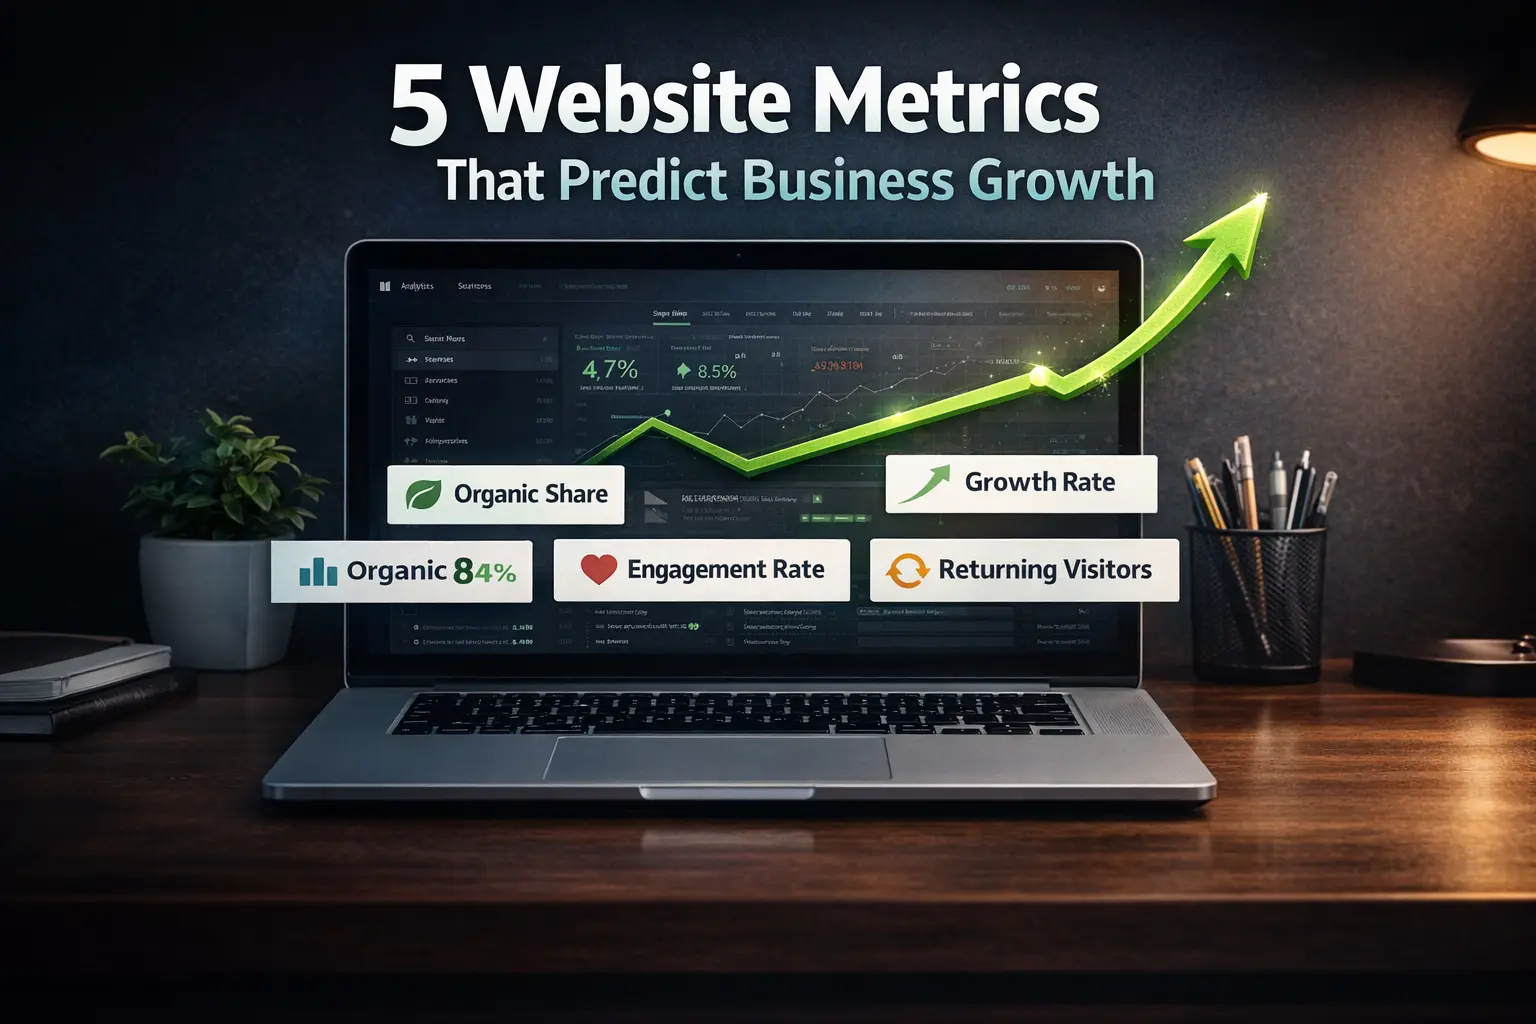
Open Google Analytics right now and you will see a lot of numbers. Page views. Sessions. Users. Average time on page. Bounce rate. Most business owners look at these every week, notice they went up or down, and then close the tab without knowing what any of it actually means for their business.
Here is the uncomfortable truth: the metrics most people watch are not the ones that predict where their business is heading. They are descriptive. They tell you what happened last month. The five website metrics that predict business growth are different. They are leading indicators. They tell you what is likely to happen next, which means they give you enough warning to do something about it.
This article is about those five metrics. Where to find them, what benchmarks to compare against, and most importantly, what each one is telling you about the future of your business.
Why Most Businesses Are Watching the Wrong Metrics
When Google Analytics loads, it defaults to showing you traffic numbers. Sessions, users, page views. These are the easiest metrics to understand and the most satisfying to watch grow. They feel like progress. But website traffic growth is a good leading indicator for lead and revenue growth only when combined with a strong conversion rate. Without that combination, growing traffic is just a vanity metric.
The same is true of bounce rate, which is one of the most misread metrics in digital marketing. A high bounce rate on a contact page is alarming. A high bounce rate on a blog post where someone read the whole article and got their answer is completely normal. Context changes everything.
The five metrics below are different because they measure the underlying health of your digital presence, not just the surface activity. Businesses whose numbers are moving in the right direction on these five indicators consistently grow. Businesses whose numbers are declining typically struggle, even if their raw traffic looks healthy.
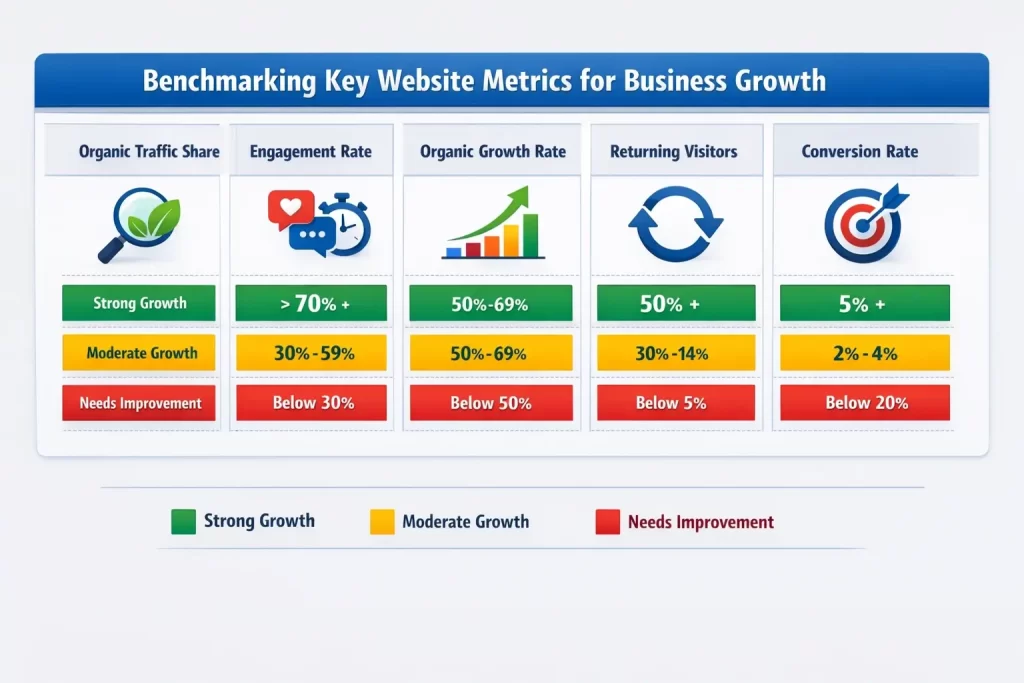
| Metric | What It Measures | Healthy Benchmark | Warning Sign |
|---|---|---|---|
| Organic Traffic Share | % of traffic from unpaid search | Above 40% organic | Below 20% organic |
| Engagement Rate | % of sessions actively engaged | 55% to 70%+ | Below 40% |
| Organic Traffic Growth Rate | Month-on-month organic trend | 5% to 15% per month | Flat or declining 3+ months |
| Returning Visitor Rate | % of visitors who come back | 30% to 50% | Below 15 to 20% |
| Conversion Rate by Source | Which channels actually convert | Tracked and growing organically | Not tracked at all |
Metric 1: Organic Traffic Share
What it is
The percentage of your total website traffic that comes from organic search, meaning unpaid Google results, rather than from paid ads, direct visits, or social media.
Where to find it
Google Analytics 4, then Reports, then Acquisition, then Traffic Acquisition. Look at the percentage breakdown by channel.
Why it predicts growth
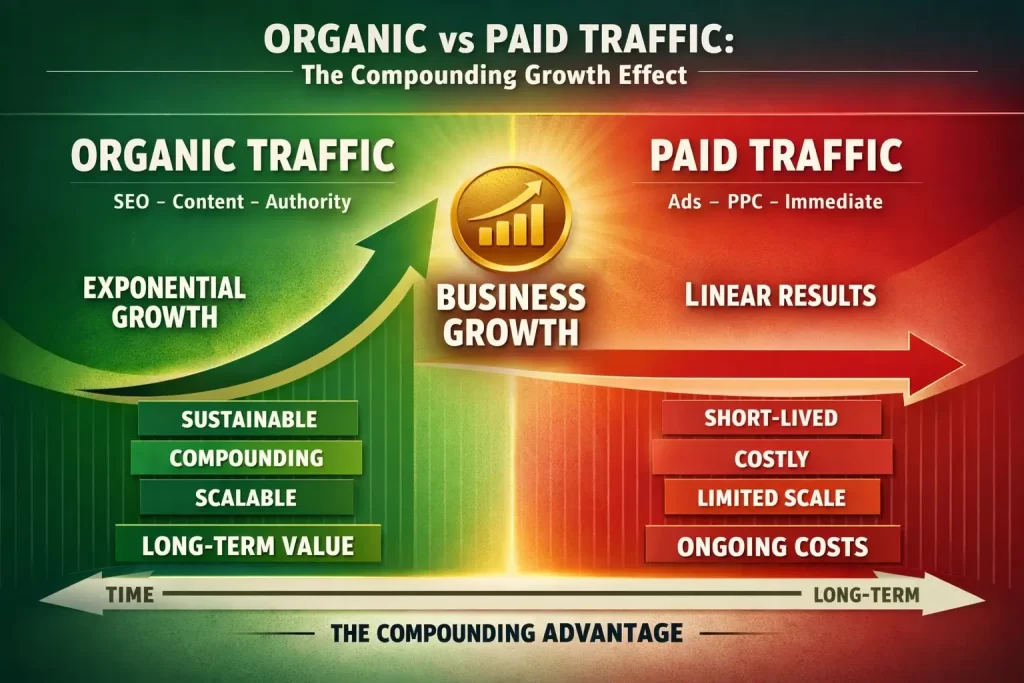
Organic search accounts for approximately 53% of all website traffic industry-wide in 2025. Businesses with a growing organic share are building something that gets more valuable over time. Businesses that rely primarily on paid traffic have to keep paying the same toll forever, and the moment the budget is cut, the traffic disappears.
Organic cost per lead is considerably lower than paid cost per lead across virtually every industry. Beyond cost, organic visitors arrive because they searched for exactly what you offer. They are warmer, more qualified, and more likely to convert than visitors who clicked a generic ad.
| Healthy looks like:Organic represents above 40% of total visits, growing month on month. | Warning sign:Organic below 20% of total traffic, declining while paid share increases. One budget cut and your traffic disappears. |
Metric 2: Engagement Rate (The Modern Bounce Rate)
What it is
In Google Analytics 4, the engagement rate replaces the old bounce rate. Google defines an engaged session as one that lasts longer than 10 seconds, includes a conversion event, or involves at least two page views. Your engagement rate is the percentage of sessions that meet at least one of these criteria.
Where to find it
Google Analytics 4, then Reports, then Engagement, then Overview. Your engagement rate is displayed at the top of the report.
Why it predicts growth
| Sites with above-average engagement time typically see 2.3x higher conversion ratesSource: spectruminfinite.com/blogs/average-time-spent-on-website-2025 |
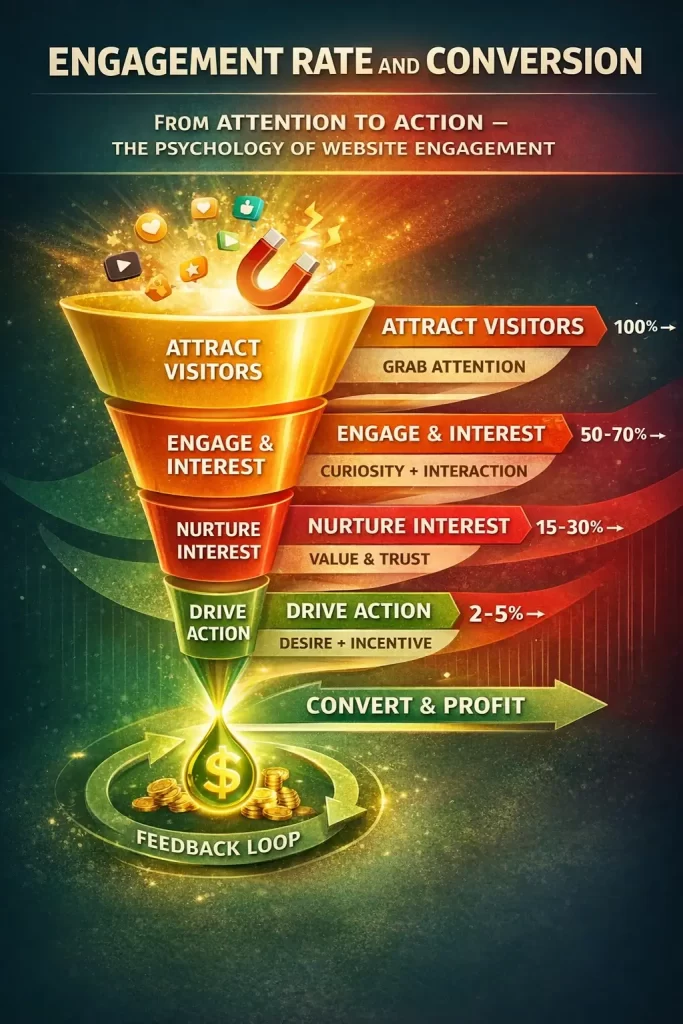
Sites with above-average engagement time typically see 2.3 times higher conversion rates than sites with below-average engagement. If people are engaging with your content, they are more likely to trust you, explore further, and eventually take the action you want them to take.
High-conversion websites maintain an average session duration of 3 minutes and 36 seconds. A low engagement rate is one of the clearest signals that something fundamental is wrong: either with your content, your design, or the match between what people expect and what they actually find.
| Healthy looks like:Engagement rate between 55% and 70%+. Visitors are staying, reading, and exploring. | Warning sign:Engagement rate below 40%. People are arriving and leaving within seconds. Investigate immediately. |
Metric 3: Organic Traffic Growth Rate
What it is
Not your total organic traffic, but its rate of change month on month. Is your organic traffic growing, flat, or declining?
Where to find it
Google Analytics 4, then Reports, then Acquisition, then Traffic Acquisition. Filter by organic search channel. Use the date comparison feature to compare month on month.
Why it predicts growth
Sites with regularly updated content see organic traffic growth of 50% to 200% compared to static sites. That gap is enormous. The business that invests in ongoing content and SEO is compounding its organic visibility over time. The business that built a site three years ago and has not touched it since is slowly losing ground.
A monthly organic traffic growth rate of 10% to 20% is generally considered healthy. If you are growing at that rate consistently over six to twelve months, your website is working as a genuine business asset. At 10% monthly growth, your organic traffic more than triples over 12 months.
| Healthy looks like:Consistent monthly organic growth of 5% to 15%. Compounding over time. | Warning sign:Flat or declining organic traffic for 3+ consecutive months. Rarely a natural plateau. Almost always a fixable problem. |
Metric 4: Returning Visitor Rate

What it is
The percentage of your total visitors who have visited your website before within a given time period. Google Analytics tracks this by recognising returning visitors via cookies.
Where to find it
Google Analytics 4, then Reports, then Retention. The retention overview shows you the ratio of new to returning users and how retention changes over time.
Why it predicts growth
| The probability of selling to an existing or returning customer is 60-70%, versus 5-20% for a new prospectSource: opensend.com/post/new-vs-returning-visitors-statistics-ecommerce |
This is the most underrated metric on this list, and the one most business owners never check. Your returning visitor rate tells you whether your website is genuinely valuable enough that people choose to come back.
Few conversions happen on a first visit, and a higher returning visitor rate is essential to brand growth. A returning visitor found your site once, had a positive enough experience to remember you, and actively came back. In a world of infinite choice and constant distraction, that is a meaningful signal about your brand’s resonance.
For most B2B service businesses, a healthy returning visitor rate sits between 30% and 50%. Rates below 20% suggest visitors are not finding the site valuable enough to warrant a return.
| Healthy looks like:Returning visitor rate between 30% and 50%. People trust you enough to come back. | Warning sign:Returning visitor rate consistently below 15%. Your website is not making an impression worth remembering. |
Metric 5: Conversion Rate by Traffic Source
What it is
Not your overall conversion rate averaged across all visitors, but your conversion rate broken down by the channel that brought each visitor. How does organic traffic convert compared to paid? How does email compare to social?
Where to find it
Google Analytics 4, then Explore, then create a Free Form exploration. Add dimensions for Session source/medium and metrics for Conversions. This reveals exactly which traffic sources are generating actual leads, not just visits.
Why it predicts growth
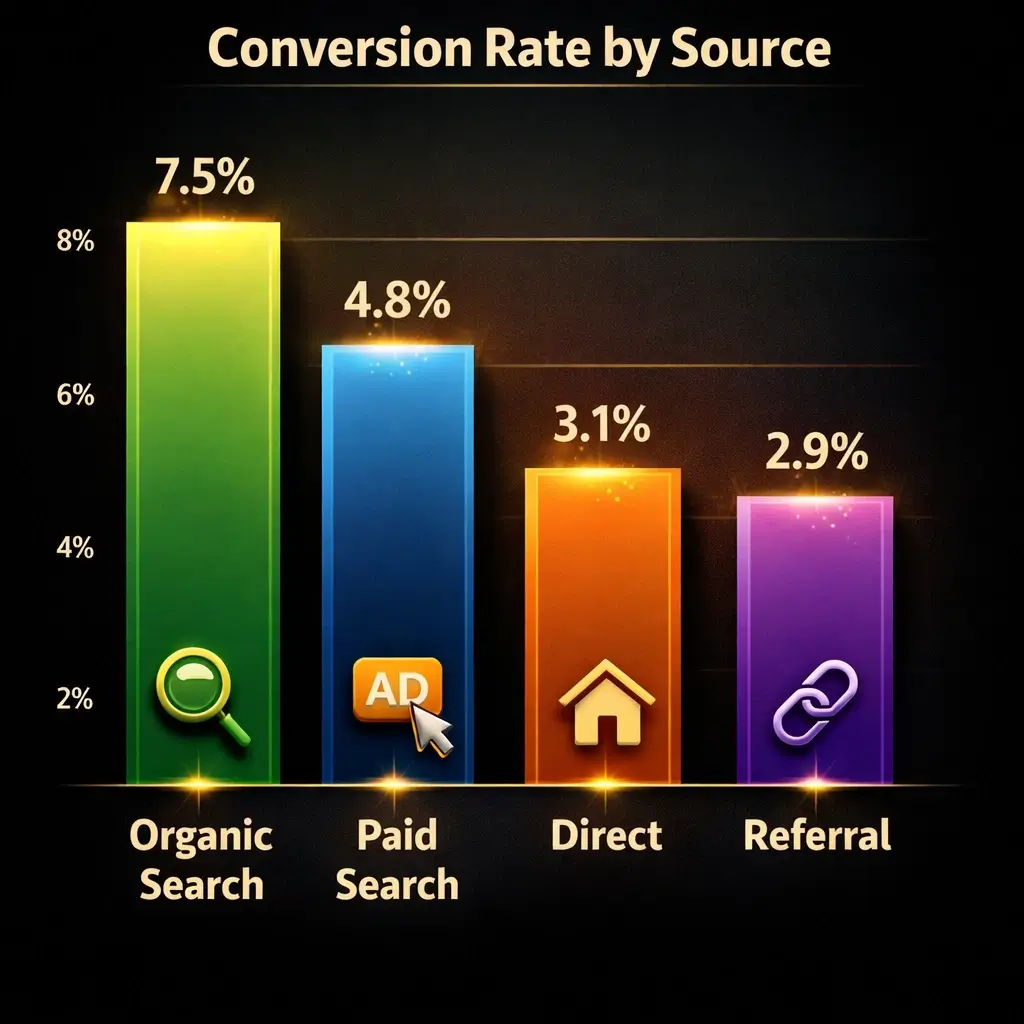
Organic visitors convert at consistently higher rates than paid visitors across most industries. This is because organic visitors arrive with high intent. They searched for something specific, found your content relevant, and clicked through. That pre-qualification process does not happen with a display ad.
The average lead-to-sale conversion rate across industries is 2.9%, but this varies enormously by traffic source. If your organic traffic converts at 4% but your paid traffic converts at 0.8%, you have a very clear argument for reallocating your marketing budget toward organic.
| Healthy looks like:Conversion rate tracked by source. Organic converting at 2% or above. Investment aligned with highest-converting channels. | Warning sign:Conversion rate not tracked by source at all. Paid traffic generating visits but almost no conversions. |
How to Read These Five Metrics Together
These metrics are most powerful when read as a system rather than in isolation. Here is what different combinations tell you.
- High organic share, strong engagement, growing organic traffic: This website is building genuine compounding value. Lead and revenue growth will follow if conversion paths are strong.
- High traffic, low engagement, poor conversion by source: Traffic is being bought or generated but the site is failing to convert it. The problem is either the site itself, the audience targeting, or the match between what traffic expects and what the site delivers.
- Low returning visitor rate, low engagement, declining organic traffic: The site is not resonating with its audience. Typically a content problem, a design credibility problem, or both.
- Strong conversion rate from organic, weak organic traffic share: The site converts well when it gets the right visitors, but is not visible enough in organic search to sustain growth without paid support. This business should invest heavily in content and SEO.
What to Do With What You Find
If you have run through these five metrics and some of them are telling you uncomfortable things, that is the most valuable outcome of reading this article. Most businesses only discover these problems when their lead volume has already dropped significantly. Catching a declining organic traffic trend or a low returning visitor rate early gives you months of runway to fix it before it becomes a revenue problem.
The most common root causes behind poor performance on these five metrics:
- A website that is technically slow or broken in ways invisible to the owner
- Content that has not been updated or expanded in more than a year
- No ongoing SEO strategy to build organic visibility over time
- A design that fails to build trust quickly enough to retain visitors
- No measurement infrastructure in place to track conversions by source
All of these are solvable. None of them are solved by spending more on paid ads.
If you are not sure where to start, our article on signs your website is costing you customers covers the diagnostic process in detail. And if the organic traffic picture is the clearest problem, our digital marketing services page explains how we approach building sustainable organic growth for clients.
The One-Page Dashboard You Should Build Today
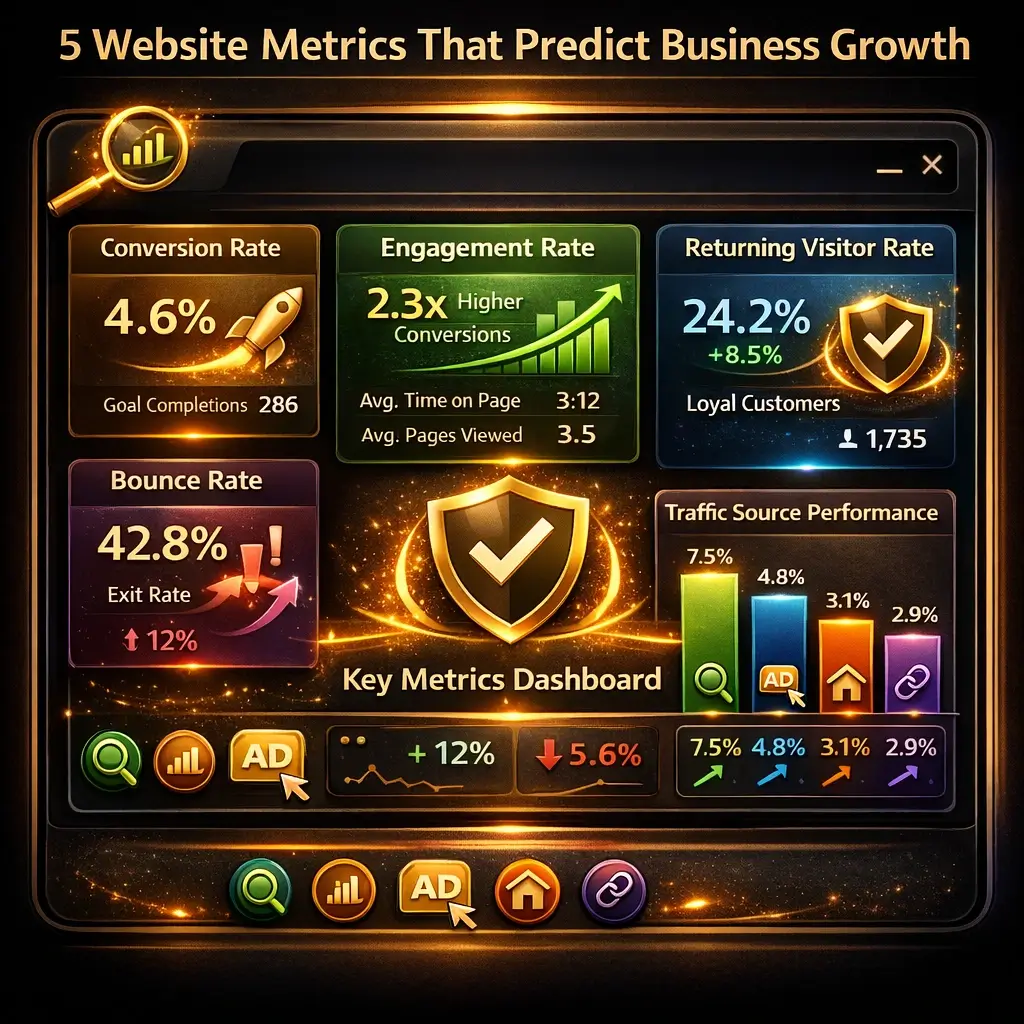
In Google Analytics 4, you can build a simple custom dashboard that shows you all five metrics in one view. Track them monthly. Note the direction of change, not just the number. A metric moving in the right direction is almost always more important than the absolute value of the metric today.
Five questions to answer every month:
- Organic traffic share: Are you above 40%? Is it trending up or down?
- Engagement rate: Are you above 55%? Is it trending up or down?
- Organic traffic growth rate: Is it growing month on month? By how much?
- Returning visitor rate: Are you above 25%? Is it trending up or down?
- Conversion rate by source: Which source converts best? Is that source growing?
If you can answer these five questions every month, you have a clearer picture of your business’s digital health than the vast majority of your competitors.
Ready to Understand What Your Website Is Actually Telling You?
The businesses that grow consistently through their websites are not the ones with the most traffic. They are the ones that understand what their metrics are actually saying and act on it systematically.
At Velacore, we work with businesses to audit, interpret, and improve exactly these kinds of metrics, building websites and content strategies that move the numbers that actually matter.
Talk to Velacore about a website performance audit and get a clear picture of where your five key metrics stand right now.
Frequently Asked Questions
How do I set up conversion tracking in Google Analytics 4?
Go to Admin, then Events, then mark your key events as conversions. For most service businesses this means form submissions, phone number clicks, and any other action that represents a genuine lead. Without this set up, the conversion rate by source metric is impossible to track accurately.
My organic traffic has been flat for six months. Is that normal?
Flat organic traffic for more than three months almost always indicates something that needs attention. Sites with regularly updated content see organic traffic growth of 50% to 200% compared to static sites. Flat traffic usually means nothing new is being published and nothing is being updated. It is rarely a natural plateau.
What is a good engagement rate for a business website?
Google defines an engaged session as one lasting longer than 10 seconds, involving a conversion event, or including at least two page views. For most business websites, an engagement rate of 55% to 70% is healthy. Above 70% is excellent. Below 40% warrants investigation into content quality and design.
Does a high returning visitor rate mean my site is performing well?
A high returning visitor rate is generally a positive sign that your content is valuable enough to bring people back. However, if your returning visitor rate is very high relative to new visitors, it can indicate you are not attracting enough new audiences. The goal is a healthy balance: enough new visitors to grow your audience and enough returning visitors to demonstrate genuine value.
Should I be more focused on improving my metrics or on getting more traffic?
For most businesses, improving existing metrics delivers a better return than acquiring more traffic. Traffic growth is only a meaningful metric when combined with strong conversion rates. Fix the fundamentals first. More traffic to a broken funnel just means more money spent for the same disappointing results.